- Bangalore - 560092
Industry
-
Architectural
-
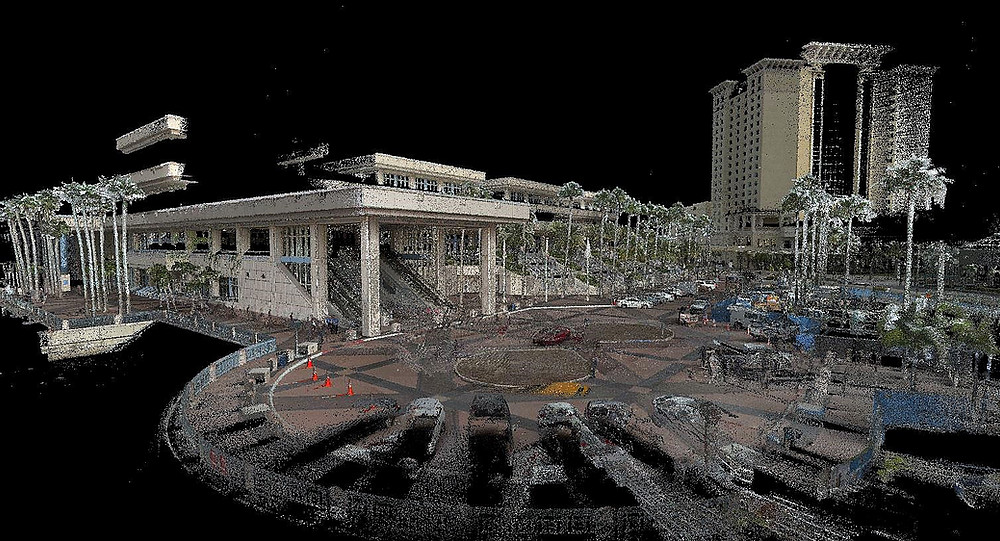
Cultural Heritage
-
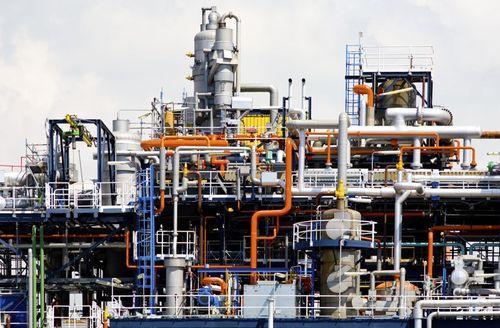
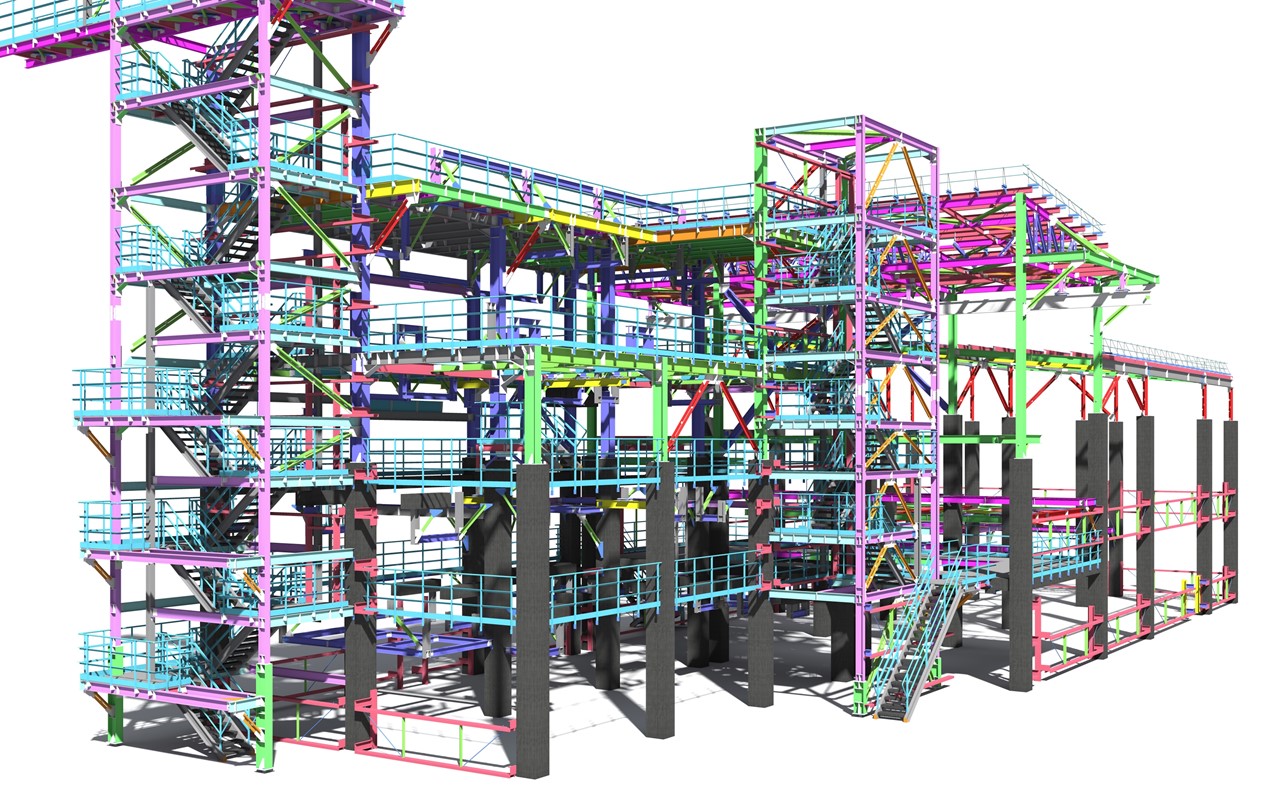
Industrial Process Plant
-
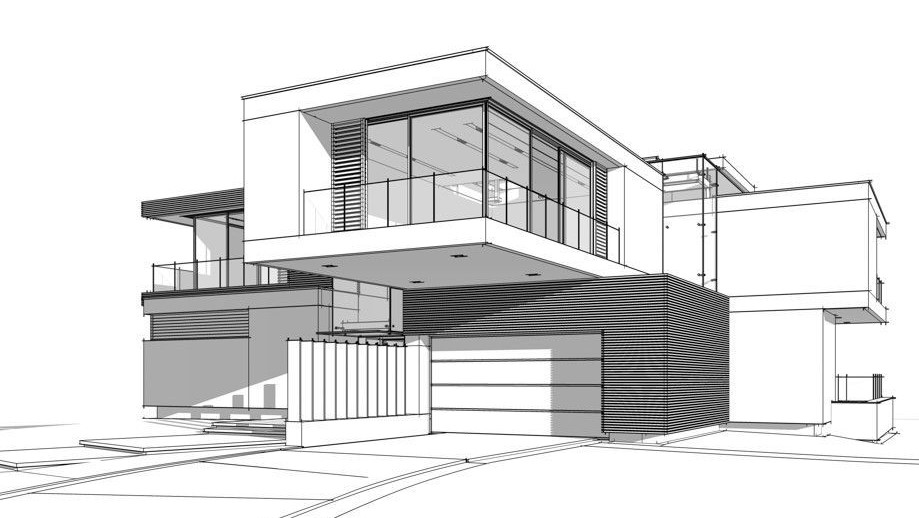
Architectural drawings
-
Airport Modeling
-
Schools
-
Bridge
-
Hospitals
-
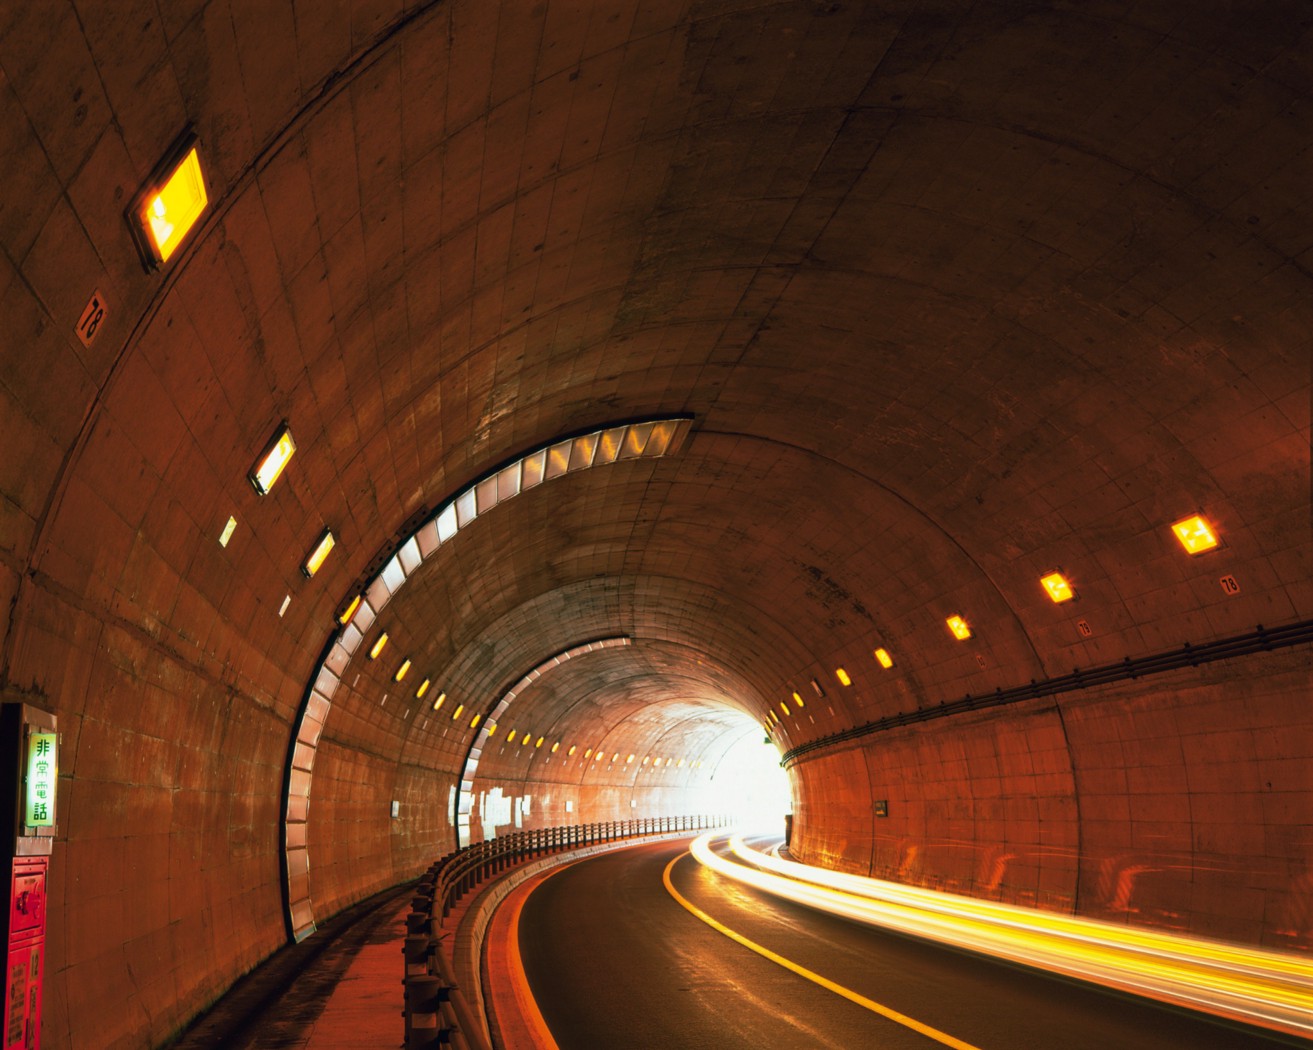
Tunnel
-
Topographic
-
Mapping


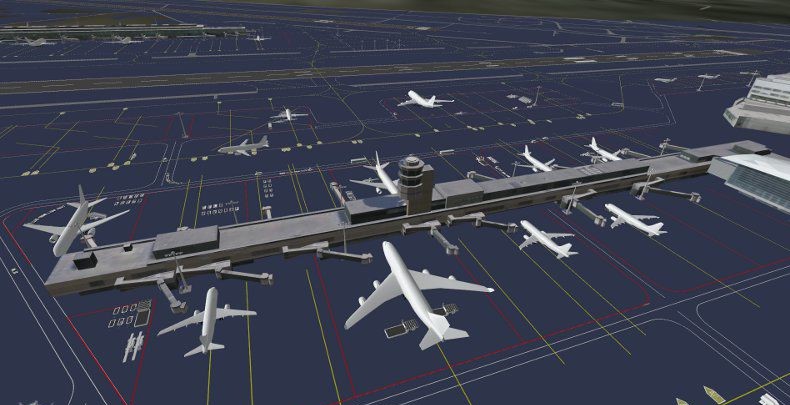

School 3D scanning is the process of analyzing three-dimensional objects more realistically to collect data on their shape and possibly their appearance (e.g. color). The collected data can then be used to construct digital 3D models. Collected 3D data is useful for a wide variety of applications.
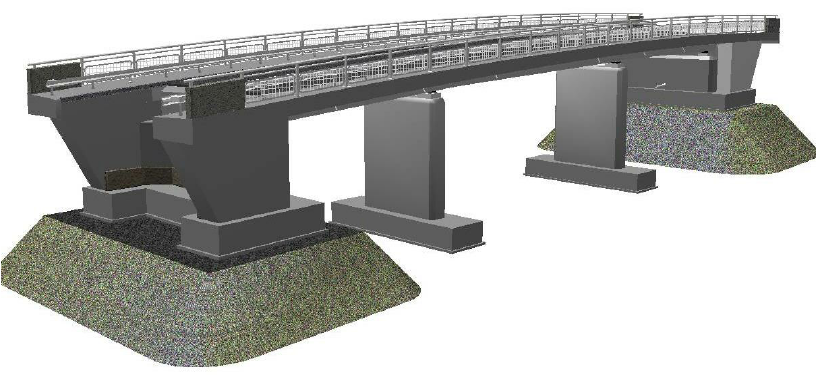
Building information modeling (BIM) in industrialized bridge construction is usually performed based on initial design information. Differences exist between the model of the structure and its actual geometric dimensions and features due to the manufacturing, transportation, hoisting, assembly, and load-bearing of the structure. These variations affect the construction project handover and facility management. The solutions available at present entail the use of point clouds to reconstruct BIM. However, these solutions still encounter problems, such as the inability to obtain the actual geometric features of a bridge quickly and accurately. Moreover, the created BIM is nonparametric and cannot be dynamically adjusted. This paper proposes a fully automatic method of reconstructing parameterized BIM by using point clouds to address the abovementioned problems. An algorithm for bridge point cloud segmentation is developed; the algorithm can separate the bridge point cloud from the entire scanning scene and segment the unit structure point cloud. Another algorithm for extracting the geometric features of the bridge point cloud is also proposed; this algorithm is effective for partially missing point clouds.
Intensive Care Units (ICUs) are some of the highest intensity areas of patient care activities in hospitals, yet documentation and understanding of the occurrence of these activities remain sub-optimal due in part to the already demanding patient care workloads of nursing staff. Recently, computer vision-based methods operating over color and depth data collected from passive mounted sensors have been developed for automated activity recognition, but have been limited to coarse or simple activities due to the complex environments in ICUs, where fast-changing activities and severe occlusion occur. In this work, we introduce an approach for tackling more challenging activities in ICUs by combining depth data from multiple sensors to form a single 3D point cloud representation and using a neural network-based model to reason over this 3D representation. We demonstrate the effectiveness of this approach using a dataset of mobility-related patient care activities collected in a clinician-guided simulation setting.